Discussion:
Length contraction
(too old to reply)
Luigi Fortunati
2023-05-21 10:16:01 UTC
Permalink
My animation
https://www.geogebra.org/m/rfa2m4ys
correctly represents the relativistic contraction of lengths?
Richard Livingston
2023-05-22 07:07:46 UTC
Permalink
Post by Luigi Fortunati
My animation
https://www.geogebra.org/m/rfa2m4ys
correctly represents the relativistic contraction of lengths?
Sorry, no. It may correctly show the object C closer from the point
of view of B (I'm not going to try to check your math), but the object
would also be foreshortened by the same amount. That is, the
object would no longer appear as a circle but as an ellipse. The
tangent point, where the dotted lines are tangent to the circle,
would always be the same point on the object C, not shifted
towards the sub-observer point (where the dashed line enters
the circle C) as your animation shows.

Rich L.
Luigi Fortunati
2023-05-22 17:16:31 UTC
Permalink
Post by Richard Livingston
Post by Luigi Fortunati
My animation
https://www.geogebra.org/m/rfa2m4ys
correctly represents the relativistic contraction of lengths?
Sorry, no. It may correctly show the object C closer from the point
of view of B (I'm not going to try to check your math), but the object
would also be foreshortened by the same amount. That is, the
object would no longer appear as a circle but as an ellipse.
Right: I fixed the animation.

But for observers, body C always remains exactly circular because the
contraction is in the direction of motion from B to C (and not
transversely).
Post by Richard Livingston
The tangent point, where the dotted lines are tangent to the circle,
would always be the same point on the object C, not shifted
towards the sub-observer point (where the dashed line enters
the circle C) as your animation shows.
Rich L.
My animation does not represent a movement in time but the
instantaneous situation when observer B (in motion) passes by observer
A.

At that moment, the Vel-A speed is always zero and the Vel-B speed is
the one chosen by the user.

If the Vel-B slider is at zero, observers A and B are both stationary
and body C is at distance 16 from both.

If the Vel-B slider is at velocity Vel-B=0.866c zero, body C is at
distance 16 from observer A (Vel-A=0) and at distance 8 (16/2) from
observer B, being gamma=2.

To each value of Vel-B corresponds a precise gamma and a precise
contraction of the BC distance.

Luigi.
Julio Di Egidio
2023-05-22 07:07:46 UTC
Permalink
Post by Luigi Fortunati
My animation
https://www.geogebra.org/m/rfa2m4ys
correctly represents the relativistic contraction of lengths?
You expect an answer "by eye"?? Where are your *formulas*, the ones
you use to build the graph?! And how long shall we repeat just that??
(Which is more of a complaint about the moderation.)

Julio
Luigi Fortunati
2023-05-22 17:16:03 UTC
Permalink
Post by Luigi Fortunati
My animation
https://www.geogebra.org/m/rfa2m4ys
correctly represents the relativistic contraction of lengths?
Where are your *formulas*, the ones you use to build the graph?!
In my animation
https://www.geogebra.org/m/rfa2m4ys
I added the formulas I used (Beta e Gamma).

Distance is contracted in proportion to the gamma factor.
Julio Di Egidio
2023-05-23 20:30:16 UTC
Permalink
Post by Luigi Fortunati
My animation
https://www.geogebra.org/m/rfa2m4ys
correctly represents the relativistic contraction of lengths?
Where are your *formulas*, the ones you use to build the graph?!
In my animation
<https://www.geogebra.org/m/rfa2m4ys>
I added the formulas I used (Beta e Gamma).
Distance is contracted in proportion to the gamma factor.
For constant (relative) motion, lengths only contract along
the direction of motion. That said, computing the distance
to C is easy, but each and every distance transforms in the
same way, so you don't just get semi-circles, that should be
an ellipse... Indeed, here is what I meant by "formulas":
<https://www.desmos.com/calculator/e20mfh6ln0>
(I am not an expert: I hope I have not made any mistakes.)

But my objection to you is one of method and understanding
what is what: a simulation requires a (mathematical) model!
Your reasoning on pretty pictures, especially since you are just
starting and have not yet developed any "correct intuitions", is
simply misguided.

Julio
Luigi Fortunati
2023-05-24 17:33:33 UTC
Permalink
Post by Julio Di Egidio
Post by Luigi Fortunati
In my animation
<https://www.geogebra.org/m/rfa2m4ys>
I added the formulas I used (Beta e Gamma).
Distance is contracted in proportion to the gamma factor.
For constant (relative) motion, lengths only contract along
the direction of motion. That said, computing the distance
to C is easy, but each and every distance transforms in the
same way, so you don't just get semi-circles, that should be
<https://www.desmos.com/calculator/e20mfh6ln0>
(I am not an expert: I hope I have not made any mistakes.)
You made no mistakes and your simulation is correct.

Thanks for the suggestion.

I corrected my animation which is now this:
https://www.geogebra.org/m/dzuyjaz6
Post by Julio Di Egidio
But my objection to you is one of method and understanding
what is what: a simulation requires a (mathematical) model!
After this last correction of mine, is my animation still missing
something to conform to the "mathematical model" you are talking about?
Post by Julio Di Egidio
Julio
Luigi
Julio Di Egidio
2023-05-25 07:18:24 UTC
Permalink
<https://www.geogebra.org/m/dzuyjaz6>
After this last correction of mine, is my animation still missing
something to conform to the "mathematical model" you are talking about?
A meaningless statement, as already noted: I am talking about
"*your* *modelling* of the problem at hand", and the need thereof.

That said, yes, by "eye inspection", you still get the tangents wrong.
Indeed, a "model" concretely is a collection of "specific formulas",
ideally together with proofs of properties of those formulas/of that
model, that ensure that the model is *correct* re the underlying
(physical, in this case) theory in question: e.g. as to how to compute
the tangents and points of tangency, as well as prove (with some
mathematical derivation) that "[t]he tangent point[s], where the dotted
lines are tangent to the circle, would always be the same point[s] on the
object C", as Richard Livingston has put it upthread (slightly adapted).

HTH,

Julio
Luigi Fortunati
2023-05-29 06:55:12 UTC
Permalink
Post by Julio Di Egidio
<https://www.geogebra.org/m/dzuyjaz6>
After this last correction of mine, is my animation still missing
something to conform to the "mathematical model" you are talking about?
A meaningless statement, as already noted: I am talking about
"*your* *modelling* of the problem at hand", and the need thereof.
My animation is modeled according to the dictates of Special
Relativity.
Post by Julio Di Egidio
That said, yes, by "eye inspection", you still get the tangents wrong.
Can you show me how you would draw the tangents?
Post by Julio Di Egidio
Julio
Luigi
wugi
2023-05-29 20:36:39 UTC
Permalink
Post by Luigi Fortunati
Post by Julio Di Egidio
Post by Luigi Fortunati
In my animation
<https://www.geogebra.org/m/rfa2m4ys>
I added the formulas I used (Beta e Gamma).
Distance is contracted in proportion to the gamma factor.
For constant (relative) motion, lengths only contract along
the direction of motion. That said, computing the distance
to C is easy, but each and every distance transforms in the
same way, so you don't just get semi-circles, that should be
<https://www.desmos.com/calculator/e20mfh6ln0>
(I am not an expert: I hope I have not made any mistakes.)
You made no mistakes and your simulation is correct.
Thanks for the suggestion.
https://www.geogebra.org/m/dzuyjaz6
Post by Julio Di Egidio
But my objection to you is one of method and understanding
what is what: a simulation requires a (mathematical) model!
After this last correction of mine, is my animation still missing
something to conform to the "mathematical model" you are talking about?
Your simulation may be more or less correct, but it doesn't help much in
one's understanding it correctly, it even may induce erroneous
understanding.

First, it should be made clear in which direction the moving observer is
supposed to move. My first impression was that he should move vertically
which didn't make sense.

Furthermore, it doesn't help to superpose both 'circles' in a same
graph, which suggests a same reference frame, where in fact different
reference frames are superposed. Now it gives the impression that "there
are two circles in space", one for each observer.

The fact is that there is only one object, but that both observers "fill
in" the space towards it, ánd the time values, differently! In order to
respect the singleness of the object, your method is not a very proper
one. There are better alternatives. One is, to make two graphs, each
with its reference frame. Another one, to display only one object, say
in the rest system, and superpose the different reference frame of the
moving observer upon that, showing the length contraction, and possibly,
time dilation effects.

Lastly, this is not what the observers are going to *see*! Einstein's
Lorentz equations don't describe objects *as seen*, they describe
*measured*, backcalculated, positions of simultaneity. What the
observers are going to see, is what the light photons are telling them,
as they arrive at each observer, come from the different parts of the
distant object. In other words, they include Doppler distortions!

There are nice examples of this distinction and of relativistic Doppler
watching around the net. When I find them back, I'll post some
links. It's also a main topic of my SRT pages
wugi's SRT world:
https://www.wugi.be/qbRelaty.html
https://www.wugi.be/paratwin.htm
https://www.youtube.com/playlist?list=PL5xDSSE1qfb6zyVKJbe8POgj-8ijmh5o0
--
guido wugi
Luigi Fortunati
2023-06-02 20:17:02 UTC
Permalink
Post by wugi
Post by Luigi Fortunati
https://www.geogebra.org/m/dzuyjaz6
Your simulation may be more or less correct, but it doesn't help much in
one's understanding it correctly, it even may induce erroneous
understanding.
First, it should be made clear in which direction the moving observer is
supposed to move. My first impression was that he should move vertically
which didn't make sense.
In my simulation:
- observer B moves (instantaneously) to the right, i.e. towards body C
- observer A is stationary with respect to body C
- Observers A and B, at time t=0 of both, share the same space and the same time
- The time of C in the reference of A is different from the time of C in the reference of B.
Post by wugi
Furthermore, it doesn't help to superpose both 'circles' in a same
graph, which suggests a same reference frame, where in fact different
reference frames are superposed. Now it gives the impression that "there
are two circles in space", one for each observer.
The fact is that there is only one object, but that both observers "fill
in" the space towards it, and the time values, differently! In order to
respect the singleness of the object, your method is not a very proper
one. There are better alternatives. One is, to make two graphs, each
with its reference frame. Another one, to display only one object, say
in the rest system, and superpose the different reference frame of the
moving observer upon that, showing the length contraction, and possibly,
time dilation effects.
Lastly, this is not what the observers are going to *see*! Einstein's
Lorentz equations don't describe objects *as seen*, they describe
*measured*, backcalculated, positions of simultaneity. What the
observers are going to see, is what the light photons are telling them,
as they arrive at each observer, come from the different parts of the
distant object. In other words, they include Doppler distortions!
Ok, let's talk about what happens when photons of light arrive on the
photographic film (the observer) and form the image.

Are Einstein's Lorentz equations able to predict whether the body C will
appear perfectly spherical or whether it will be squashed in the
direction of motion?

[[Mod. note -- Yes.

As wugi noted, (1) and (2) below are very different questions, with
very different answers:
(1) What are the coordinate positions of the objects measured (i.e.,
"backcalculated", as wugi quite correctly terms it) in different
(inertial) reference frames, as determined by the Lorenz transformation?
(2) What image(s) would taken by a (ideal) camera located at a certain
point given (1) together with differential light-travel-time effects
(i.e., the Lampa-Penrose-Terrell effect, often just called the Terrell
effect or Terrell rotation)?

(1) is what's usually meant when we ask what an observer "measures" in
special relativity. (2) is what you (Luigi) have now asked about.

See
https://en.wikipedia.org/wiki/Terrell_rotation
for a nice introduction to (2). Reference 4 in that Wikipedia article
(written by Victor Weisskopf!) is a very clear exposition of the effect,
explicitly working out the Terrell rotation for a moving cube and then
generalizing it to an arbitrary-shaped body. The original 1960 paper is
(still) behind a paywall :(, but as of a few minutes ago google scholar
finds a free copy.
-- jt]]
wugi
2023-06-05 06:58:33 UTC
Permalink
Post by Luigi Fortunati
Post by wugi
Post by Luigi Fortunati
https://www.geogebra.org/m/dzuyjaz6
Your simulation may be more or less correct, but it doesn't help much in
one's understanding it correctly, it even may induce erroneous
understanding.
First, it should be made clear in which direction the moving observer is
supposed to move. My first impression was that he should move vertically
which didn't make sense.
- observer B moves (instantaneously) to the right, i.e. towards body C
- observer A is stationary with respect to body C
- Observers A and B, at time t=0 of both, share the same space and the same time
- The time of C in the reference of A is different from the time of C in the reference of B.
Post by wugi
Furthermore, it doesn't help to superpose both 'circles' in a same
graph, which suggests a same reference frame, where in fact different
reference frames are superposed. Now it gives the impression that "there
are two circles in space", one for each observer.
The fact is that there is only one object, but that both observers "fill
in" the space towards it, and the time values, differently! In order to
respect the singleness of the object, your method is not a very proper
one. There are better alternatives. One is, to make two graphs, each
with its reference frame. Another one, to display only one object, say
in the rest system, and superpose the different reference frame of the
moving observer upon that, showing the length contraction, and possibly,
time dilation effects.
Lastly, this is not what the observers are going to *see*! Einstein's
Lorentz equations don't describe objects *as seen*, they describe
*measured*, backcalculated, positions of simultaneity. What the
observers are going to see, is what the light photons are telling them,
as they arrive at each observer, come from the different parts of the
distant object. In other words, they include Doppler distortions!
Ok, let's talk about what happens when photons of light arrive on the
photographic film (the observer) and form the image.
Are Einstein's Lorentz equations able to predict whether the body C will
appear perfectly spherical or whether it will be squashed in the
direction of motion?
[[Mod. note -- Yes.
As wugi noted, (1) and (2) below are very different questions, with
(1) What are the coordinate positions of the objects measured (i.e.,
"backcalculated", as wugi quite correctly terms it) in different
(inertial) reference frames, as determined by the Lorenz transformation?
(2) What image(s) would taken by a (ideal) camera located at a certain
point given (1) together with differential light-travel-time effects
(i.e., the Lampa-Penrose-Terrell effect, often just called the Terrell
effect or Terrell rotation)?
(1) is what's usually meant when we ask what an observer "measures" in
special relativity. (2) is what you (Luigi) have now asked about.
See
https://en.wikipedia.org/wiki/Terrell_rotation
for a nice introduction to (2). Reference 4 in that Wikipedia article
(written by Victor Weisskopf!) is a very clear exposition of the effect,
explicitly working out the Terrell rotation for a moving cube and then
generalizing it to an arbitrary-shaped body. The original 1960 paper is
(still) behind a paywall :(, but as of a few minutes ago google scholar
finds a free copy.
-- jt]]
Thank you. About Terrell rotation, if I remember correctly it would seem
to alledge that length contraction is part of the "seeing" effects, in
that the object, together with its backside becoming visible, would seem
rotated, and total length "seen" would be preserved. This is messing up
what I call "Lorentz" data (measuring, backcalculating: length
contraction) with "Einstein" data (*seeing, watching* , the back side
becoming visible).

But it is partly true. From my webside which I mentioned in another
reply, let's see some examples here.
How would a frontline that's approaching an observer at relativistic
speed be perceived? Here:
Loading Image...
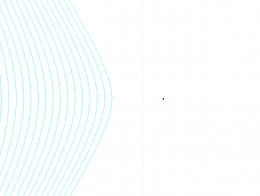
(fat dot = observer, dotted line = actual 'true' position, rightmost
curve = as seen 'now', others = previous positions.)
Same case, after having past by the observer:
Loading Image...
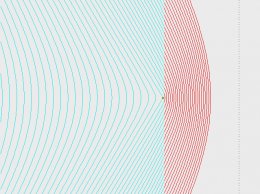
(doppler 'blue shift' at approach, 'red shift' at regression)
A series of frontlines combined into a "squadron" of squares:
Loading Image...
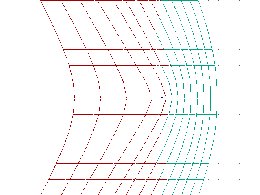
(dots = actual position of the squad)

Notice the following "seeing/watching" effects:
At approach, a "length dilation" is seen, not a contraction!
At regression, an extra length contraction is seen.
This is due to the fact that light needs the longest time to reach the
observer from the farmost parts of the moving object.
The squares appear more or less distorted, according to position and
distance from observer. This is analogous to, and more general than,
what Terrell rotation tries to tell us.
But observe this! ->
The true *Lorentz length contraction can be seen*, but only
perpendicular to the motion, and far enough away: in our picture, along
the vertical through the observer point, at the far distances up and
down (compare with dot positions).

I'd promised some other links to the effects of 'seeing' relativistic
motion. Here are some:
https://www.physicsforums.com/threads/terrell-revisited-the-invisibility-of-the-lorentz-contraction.520875/page-4

(with nice animations by J. Doolin)

https://www.tempolimit-lichtgeschwindigkeit.de/ueberblick/1
(with links to more videos)

https://www.spacetimetravel.org/tompkins/tompkins.pdf
(with other cases)

https://timms.uni-tuebingen.de/tp/UT_20040806_001_sommeruni2004_0001
(a lecture with animation videos of previous cases)
--
guido wugi
wugi
2023-05-30 16:48:52 UTC
Permalink
Post by Julio Di Egidio
<https://www.geogebra.org/m/dzuyjaz6>
After this last correction of mine, is my animation still missing
something to conform to the "mathematical model" you are talking
about?
A meaningless statement, as already noted: I am talking about
"*your* *modelling* of the problem at hand", and the need thereof.
That said, yes, by "eye inspection", you still get the tangents wrong.
Indeed, a "model" concretely is a collection of "specific formulas",
ideally together with proofs of properties of those formulas/of that
model, that ensure that the model is *correct* re the underlying
(physical, in this case) theory in question: e.g. as to how to compute
the tangents and points of tangency, as well as prove (with some
mathematical derivation) that "[t]he tangent point[s], where the dotted
lines are tangent to the circle, would always be the same point[s] on the
object C", as Richard Livingston has put it upthread (slightly adapted).
Looking at your own simulation, the 'proof' seems easy: the animation
for b can be interpreted as a 'rotation' in a plane through the
horizontal axis and our eyes. So, the tangent lines should remain tangent.
--
guido wugi
wugi
2023-06-05 03:53:57 UTC
Permalink
Post by Luigi Fortunati
Post by Julio Di Egidio
Post by Luigi Fortunati
In my animation
<https://www.geogebra.org/m/rfa2m4ys>
I added the formulas I used (Beta e Gamma).
Distance is contracted in proportion to the gamma factor.
For constant (relative) motion, lengths only contract along
the direction of motion. That said, computing the distance
to C is easy, but each and every distance transforms in the
same way, so you don't just get semi-circles, that should be
<https://www.desmos.com/calculator/e20mfh6ln0>
(I am not an expert: I hope I have not made any mistakes.)
You made no mistakes and your simulation is correct.
Thanks for the suggestion.
https://www.geogebra.org/m/dzuyjaz6
Post by Julio Di Egidio
But my objection to you is one of method and understanding
what is what: a simulation requires a (mathematical) model!
After this last correction of mine, is my animation still missing
something to conform to the "mathematical model" you are talking about?
It is not showing the true 'embedding' of both 'circles' in spacetime,
so it doesn't put in evidence how different events come into play for
configuring them. You show us "a" space wherein you drop two
space-visions (from two systems), but you don't show us time and the
different time-visions involved.

I've tried a space-time model of what you want to show, see here:
https://www.desmos.com/calculator/x1wfo7kobn?lang=nl

We have an x,ct rest and an x',ct' moving system; the y-axis has to be
added 'mentally' perpendicular to the screen; the (x,y) circles involved
are shown as ellipse projections.

The "rest circle" object is measured in the rest system by events AB, in
the moving system by events A'B', all comprised in its red world line
band. Notice how we can never have the "same" instantaneous circle,
measured "differently" in the two systems: different events in space and
time are involved!

To stress the reciprocity of this feature, I've added the corresponding
unit circle for the moving system, as the green world line band. Notice
how the 'moving' unit circle is measured equally length-contracted by
the rest system. Red and green circles represent the same units in their
respective system, but their intervening events don't mingle!
--
guido wugi
Luigi Fortunati
2023-06-07 16:52:01 UTC
Permalink
Initially I was asking about the contraction of the distances between
the observers and body C, then the discussion shifted to the
contraction of body C.

I return to the initial question with my simulation
https://www.geogebra.org/m/ujwjmgt8

Is it correct to say that for the alien flying disk the Earth-Sun
distance is 4.15 light-minutes?
wugi
2023-06-08 07:48:20 UTC
Permalink
Post by Luigi Fortunati
Initially I was asking about the contraction of the distances between
the observers and body C, then the discussion shifted to the
contraction of body C.
I return to the initial question with my simulation
https://www.geogebra.org/m/ujwjmgt8
Is it correct to say that for the alien flying disk the Earth-Sun
distance is 4.15 light-minutes?
Perhaps, but again (and again) your picture is not a complete one, in
that the Sun's image is not representative for both reference systems.

Look at my own desmos file: both observers, Earth and alien, are "at the
same event" in O.
But to Earth, the simultaneous position of the Sun is determined by
events AB. To the alien, it is determined by other (later ones, in
Earth's system) events A'B'.
Your single picture of the Sun has to represent these two
non-simultaneous event cases.
Also, while Earth's x-axis can be laid out as such in your picture,
alien's x'-axis must be understood as covering events that are
non-simultaneous in Earth's system.
--
guido wugi
Luigi Fortunati
2023-06-09 09:28:21 UTC
Permalink
Post by wugi
Post by Luigi Fortunati
Initially I was asking about the contraction of the distances between
the observers and body C, then the discussion shifted to the
contraction of body C.
I return to the initial question with my simulation
https://www.geogebra.org/m/ujwjmgt8
Is it correct to say that for the alien flying disk the Earth-Sun
distance is 4.15 light-minutes?
Perhaps, but again (and again) your picture is not a complete one, in
that the Sun's image is not representative for both reference systems.
Look at my own desmos file: both observers, Earth and alien, are "at the
same event" in O.
But to Earth, the simultaneous position of the Sun is determined by
events AB. To the alien, it is determined by other (later ones, in
Earth's system) events A'B'.
Your single picture of the Sun has to represent these two
non-simultaneous event cases.
Also, while Earth's x-axis can be laid out as such in your picture,
alien's x'-axis must be understood as covering events that are
non-simultaneous in Earth's system.
Why all these complications?

The commander of the spaceship does not care how far the Sun is from
the Earth, he is only interested in how far the Sun is from *his*
spaceship (in *his* reference), in light minutes, at the moment in
which it passes close to the Earth (the only event in common).

Is there a single answer to his legitimate question?

And is the right answer 4.15 light-minutes or is it something else?

[[Mod. note -- The complications are inherent to the physical situation.

The phrase "at the moment in which it [the spaceship] passes close to
the Earth" specifies an event, and (if we treat the Earth as a point,
and idealise "close to the Earth" as passing through the Earth-point)
all observers can agree on this event.

But simultaneity is only local in special relativity, not global.
That is, different observers *disagree* about which event on the Sun's
worldline is at the same time as the spaceship-passing-through-the-Earth-point
event. To put it another way, if we imagine an ideal clock at (and
moving with) the Sun, then different observers will compute different
answers to the question
At the time when the spacecraft passes through the
Earth-point, what is the Sun-point's clock reading?

And since (in the spaceship inertial-reference-frame) the Sun is moving,
asking for its position requires specifying *when* to measure that position,
i.e., it requires implicitly or explicitly specifying the Sun-point clock
reading at which you want that position.

If I understand your question correctly, you've asked for the Earth-Sun
distance as measured in the spaceship inertial-reference-frame, i.e.,
you've asked for the Sun's distance from the Earth (or equivalently,
the spaceship) at the Sun-point clock reading which is
simultaneous-in-the-spaceship-inertial-reference-frame
to the spaceship-passing-through-the-Earth-point event.

Without working it out, I suspect the answer is 4.15 light-minutes.
-- jt]]
Luigi Fortunati
2023-06-11 07:21:31 UTC
Permalink
Post by Luigi Fortunati
I return to the initial question with my simulation
https://www.geogebra.org/m/ujwjmgt8
...
[[Mod. note -- The complications are inherent to the physical situation.
The phrase "at the moment in which it [the spaceship] passes close to
the Earth" specifies an event, and (if we treat the Earth as a point,
and idealise "close to the Earth" as passing through the Earth-point)
all observers can agree on this event.
But simultaneity is only local in special relativity, not global.
That is, different observers *disagree* about which event on the Sun's
worldline is at the same time as the
spaceship-passing-through-the-Earth-point event. To put it another way, if
we imagine an ideal clock at (and moving with) the Sun, then different
observers will compute different answers to the question
At the time when the spacecraft passes through the
Earth-point, what is the Sun-point's clock reading?
You want to talk about times and not about spaces.

Okay.

In the position of my drawing, will the spacecraft arrive at the Sun
after 9.58 minutes of *its* time (8.3/0.866) or after 4.79 minutes
(4.15/0.866)?

I ask about the time of the spaceship, other times are of no interest.

[[Mod. note -- If I'm understanding things correctly, 4.79 minutes. -- jt]]
Luigi Fortunati
2023-06-14 10:44:55 UTC
Permalink
Post by Luigi Fortunati
You want to talk about times and not about spaces.
Okay.
In the position of my drawing, will the spacecraft arrive at the Sun=20
after 9.58 minutes of *its* time (8.3/0.866) or after 4.79 minutes=20
(4.15/0.866)?
I ask about the time of the spaceship, other times are of no interest.
[[Mod. note -- If I'm understanding things correctly, 4.79 minutes. -- =
jt]]

Exact.

If the spacecraft (which is next to Earth) travels at a speed of 0.866c=20
and takes 4.79 minutes to reach the Sun, then the spacecraft's distance=20
from the Sun is d=3Dv*t=3D0.855*4.79=3D4.15 light-minutes, half the dista=
nce=20
to Earth-Sun (8.3 minutes-light).

Here's how you can *see* (with the eyes, with the camera or with the=20
monitor) the contraction of distances: observing the size of the image=20
of the Sun, as in my animation
https://www.geogebra.org/m/cux34wvb
where the ray of the Sun on the spaceship's monitor (4.15 light-minutes=20
away) is twice as large as it appears on the Earth's monitor (8.3=20
light-minutes away).
Luigi Fortunati
2023-06-16 18:54:06 UTC
Permalink
Post by Luigi Fortunati
In the position of my drawing, will the spacecraft arrive at the Sun=20
after 9.58 minutes of *its* time (8.3/0.866) or after 4.79 minutes=20
(4.15/0.866)?
I ask about the time of the spaceship, other times are of no interest.
[[Mod. note -- If I'm understanding things correctly, 4.79 minutes. -- =
jt]]
Exact.
If the spacecraft (which is next to Earth) travels at a speed of 0.866c
and takes 4.79 minutes to reach the Sun, then the spacecraft's distance
from the Sun is d=v*t=0.866*4.79=4.15 light-minutes, half the distance
to Earth-Sun (8.3 minutes-light).
Here's how you can *see* (with the eyes, with the camera or with the
monitor) the contraction of distances: observing the size of the image
of the Sun, as in my animation
https://www.geogebra.org/m/cux34wvb
where the ray of the Sun on the spaceship's monitor (4.15 light-minutes
away) is twice as large as it appears on the Earth's monitor (8.3
light-minutes away).
Reflecting on my animation, the images that appear on the monitors concern the moment in which the light rays from the Sun arrive on the Earth and on the spaceship.

But if their arrival is contemporary in the two references, their departure cannot be.

And then, I try to calculate the departure and the path of the light rays in the two references.

In the terrestrial reference the calculation is easy, the rays arrive on the Earth after 8.3 minutes and, therefore, have traveled a distance of 8.3 light-minutes.

In the spaceship reference, however, the calculation is a bit more complicated.

In this frame, the spacecraft is stationary and the Sun is approaching at speed v=0.866c, while the light rays is approaching speed v=c.
Post by Luigi Fortunati
From my calculations, these light rays that arrive at the spaceship
have traveled for an enormously longer time than the 8.3 minutes of the rays that arrive on Earth: they arrive after almost 31 minutes!

Consequently, they will have traveled a distance of 31 light-minutes!

It seems to me a disproportionate time and space: can you tell me if my calculation is correct and, if not, how far the light rays that reach the spaceship have traveled when it passes close to the Earth?
Luigi Fortunati
2023-06-09 08:54:56 UTC
Permalink
And this is the other question: how do moving spherical bodies appear
in monitors and photographs?

In my animation
https://www.geogebra.org/m/kh38nfpd
where there is the body C in motion and the body D stationary in the
reference of the monitor, I tried to give an answer.

Is it true that on the monitor (and in the photos) body D appears
spherical and body C appears squashed in the direction of motion?

[[Mod. note -- I can't tell from your your wording whether you are
asking about
(1) What are the coordinate positions of the objects measured (i.e.,
"backcalculated", as wugi quite correctly termed it) by special-relativity
observers in different (inertial) reference frames?, or
(2) What image(s) would taken by (ideal) cameras located at some positions,
taking into account differential light-travel-time effects (i.e., the
Lampa-Penrose-Terrell effect, often just called the Terrell effect or
Terrell rotation)?

Roughly speaking, if you mean (1) then the answer to your question is "yes",
but if you mean (2) then the answer to your question is "no".
-- jt]]
Luigi Fortunati
2023-06-11 07:17:57 UTC
Permalink
Post by Luigi Fortunati
And this is the other question: how do moving spherical bodies appear
in monitors and photographs?
In my animation
https://www.geogebra.org/m/kh38nfpd
where there is the body C in motion and the body D stationary in the
reference of the monitor, I tried to give an answer.
Is it true that on the monitor (and in the photos) body D appears
spherical and body C appears squashed in the direction of motion?
[[Mod. note -- I can't tell from your your wording whether you are
asking about
(1) What are the coordinate positions of the objects measured (i.e.,
"backcalculated", as wugi quite correctly termed it) by
special-relativity observers in different (inertial) reference fram=
es?,
Post by Luigi Fortunati
or (2) What image(s) would taken by (ideal) cameras located at some
positions,
Not from "cameras in some positions" but from a single and specific
camera: that of observer B.

And since the body C is spherical, it can only appear as an ordinary
sphere or as a sphere squeezed in the direction of motion (and in no
other way).

So I repeat the question rigorously and clearly: how does the (moving)
body C appear on B's monitor, does it appear squashed or not squashed?

[[Mod. note -- I'm sorry, I still don't know what you're asking. That
is, I don't know if your "monitor" is supposed to show (1) or (2).

Your animation has the monitor showing C squeezed in the direction of
motion, which would be correct for (1).

But in your message you refer to a "camera", which makes me suspect you
are asking about (2), in which case the monitor (showing the image formed
by an ideal camera placed at position B) will show C as a sphere, rotated
in a somewhat unobvious (that's why the effect is often called Terrell
*rotation*). See
https://en.wikipedia.org/wiki/Terrell_rotation
for an explanation.
-- jt]]
Luigi Fortunati
2023-06-11 20:59:37 UTC
Permalink
Post by Luigi Fortunati
[[Mod. note -- I'm sorry, I still don't know what you're asking. That
is, I don't know if your "monitor" is supposed to show (1) or (2).
Your animation has the monitor showing C squeezed in the direction of
motion, which would be correct for (1).
But in your message you refer to a "camera", which makes me suspect you
are asking about (2), in which case the monitor (showing the image formed
by an ideal camera placed at position B) will show C as a sphere, rotated
in a somewhat unobvious (that's why the effect is often called Terrell
*rotation*). See
https://en.wikipedia.org/wiki/Terrell_rotation
for an explanation.
-- jt]]
Thanks, now I understand that, on the monitor and on the photos, the
spherical body C of my animation appears perfectly spherical and
identical to the body D, without any relativistic contraction.

Luigi.
wugi
2023-06-11 20:59:19 UTC
Permalink
"only squeezed in the direction of motion", so here you ask about the
Lorentz backcalculated *motion measurement*, not about *seeing the
moving sphere*.
Post by Luigi Fortunati
So I repeat the question rigorously and clearly: how does the (moving)
body C appear on B's monitor, does it appear squashed or not squashed?
Here again about *seeing*.
Post by Luigi Fortunati
[[Mod. note -- I'm sorry, I still don't know what you're asking. That
is, I don't know if your "monitor" is supposed to show (1) or (2).
Your animation has the monitor showing C squeezed in the direction of
motion, which would be correct for (1).
His animation is about Lorentz contraction measurement, not about
cameras recording motion "live".
Post by Luigi Fortunati
But in your message you refer to a "camera", which makes me suspect you
are asking about (2), in which case the monitor (showing the image formed
by an ideal camera placed at position B) will show C as a sphere, rotated
in a somewhat unobvious (that's why the effect is often called Terrell
*rotation*). See
https://en.wikipedia.org/wiki/Terrell_rotation
for an explanation.
-- jt]]
His confusion remains...

FWIW, Luigi, your animation is about Lorentz contraction, not about what
cameras will record.
If you want a related example (I'm not going to redo your simulation),
look again at my picture of watching the approach, passing by, and
regression, of a squadron of squares:
https://wugi.be/paratwin.htm =>
Loading Image...

The squares are Lorentz contracted (see "actual position" dots at the
right).
They are *seen* as quadrangles, ie distorted rectangles.
At approach there is blueshift, at regression redshift (my colors are
inverted, for a white background;).
At approach the speed seen is greater than the motion velocity v (it
becomes infinite for v=c), at regression it is less than v (it becomes
c/2 for v=c).
At approach there is a seen length expansion(! it becomes infinite for
v=c), at regression an extra length contraction(! it becomes L/2gamma
for v=c IIRC).

Now if you want to visualise spheres, or circles, fill in any of the
quadrangles with a corresponding ellipse-like figure, that's how the
distorted circles are going to be seen. If you want a symmetrical
circle, take 2*2 adjoining squares, 2 along either side of the axis of
symmetry through the observer (the small black circle).
--
guido wugi
Luigi Fortunati
2023-06-12 07:09:38 UTC
Permalink
Post by wugi
...
FWIW, Luigi, your animation is about Lorentz contraction, not about what
cameras will record.
If you want a related example (I'm not going to redo your simulation),
look again at my picture of watching the approach, passing by, and
https://wugi.be/paratwin.htm =>
https://wugi.be/MySRT/Squad.gif
The squares are Lorentz contracted (see "actual position" dots at the
right).
They are *seen* as quadrangles, ie distorted rectangles.
At approach there is blueshift, at regression redshift (my colors are
inverted, for a white background;).
At approach the speed seen is greater than the motion velocity v (it
becomes infinite for v=c), at regression it is less than v (it becomes
c/2 for v=c).
At approach there is a seen length expansion(! it becomes infinite for
v=c), at regression an extra length contraction(! it becomes L/2gamma
for v=c IIRC).
Now if you want to visualise spheres, or circles, fill in any of the
quadrangles with a corresponding ellipse-like figure, that's how the
distorted circles are going to be seen. If you want a symmetrical
circle, take 2*2 adjoining squares, 2 along either side of the axis of
symmetry through the observer (the small black circle).
--
guido wugi
The monitors and photos capture the images present on the place and, therefore, show exactly what the eyes see.

I don't understand how they (monitors and cameras) can represent anything else.

I had believed that the contraction of a sphere could be "seen" and, instead, it is not so.

The moderator directed me to the right path which is the one represented by my last animation
https://www.geogebra.org/m/axxtdurx
where the moving body C is exactly equal to the stationary body D.

Here's the lesson: the contraction of a moving sphere is like the trick: it's there but you can't "see".

Luigi.
wugi
2023-06-16 19:35:50 UTC
Permalink
[[Mod. note -- I apologise for the delay in processing this article,
which arrived in the moderation system on 2023-06-12. -- jt]]
Post by Luigi Fortunati
Post by wugi
...
FWIW, Luigi, your animation is about Lorentz contraction, not about what
cameras will record.
If you want a related example (I'm not going to redo your simulation),
look again at my picture of watching the approach, passing by, and
https://wugi.be/paratwin.htm =>
https://wugi.be/MySRT/Squad.gif
The squares are Lorentz contracted (see "actual position" dots at the
right).
They are *seen* as quadrangles, ie distorted rectangles.
At approach there is blueshift, at regression redshift (my colors are
inverted, for a white background;).
At approach the speed seen is greater than the motion velocity v (it
becomes infinite for v=c), at regression it is less than v (it becomes
c/2 for v=c).
At approach there is a seen length expansion(! it becomes infinite for
v=c), at regression an extra length contraction(! it becomes L/2gamma
for v=c IIRC).
Now if you want to visualise spheres, or circles, fill in any of the
quadrangles with a corresponding ellipse-like figure, that's how the
distorted circles are going to be seen. If you want a symmetrical
circle, take 2*2 adjoining squares, 2 along either side of the axis of
symmetry through the observer (the small black circle).
--
guido wugi
The monitors and photos capture the images present on the place and, therefore, show exactly what the eyes see.
I don't understand how they (monitors and cameras) can represent anything else.
I had believed that the contraction of a sphere could be "seen" and, instead, it is not so.
The moderator directed me to the right path which is the one represented by my last animation
https://www.geogebra.org/m/axxtdurx
where the moving body C is exactly equal to the stationary body D.
Which of course it isn't, how wrong can one be.
Post by Luigi Fortunati
Here's the lesson: the contraction of a moving sphere is like the trick: it's there but you can't "see".
Did you even have a single look at my picture?
https://wugi.be/MySRT/Squad.gif
The squares are *seen* as (very) distorted quadrangles. So would the
inscribed circles/spheres.
Now it may be that the latter would look *less* distorted, because their
*angle of vision* varies less than that of the squares' appearances
themselves, as the perpendicular (to motion) directions are not
contracted. Try imagining angles of vision to inscribed circles. Well
then, spheres might look less distorted, but their meridians (and other
circles) will certainly do more so!

As for the Terell rotation,
https://en.wikipedia.org/wiki/Terrell_rotation
as I've said before,
that's just a special case of the distortions seen, valid only
perpendicular to the direction of motion, and far enough away, in my
picture: at the far end of the vertical through the observer.
Look carefully, comparing with the 'actual position' dots at the right:
that's the only area where the Lorentz contraction can 'really' be *seen*!

More on looking at relativistic spheres:
https://www.spacetimetravel.org/tompkins/tompkins.pdf
https://www.spacetimetravel.org/tompkins/1 (look at sphere animations!)
https://www.tempolimit-lichtgeschwindigkeit.de/ueberblick/1 of which:
https://www.tempolimit-lichtgeschwindigkeit.de/fussball
https://www.tempolimit-lichtgeschwindigkeit.de/sphere/sphere.pdf
https://www.tempolimit-lichtgeschwindigkeit.de/sphere/1

though I prefer to 'look at' cubes:
https://www.tempolimit-lichtgeschwindigkeit.de/tompkins
https://www.tempolimit-lichtgeschwindigkeit.de/filme/wuerfelketten/wuerfelketten-xd-640x480.mp4
--
guido wugi
Luigi Fortunati
2023-06-17 21:01:36 UTC
Permalink
Post by wugi
...
As for the Terell rotation,
https://en.wikipedia.org/wiki/Terrell_rotation
as I've said before,
that's just a special case of the distortions seen, valid only
perpendicular to the direction of motion, and far enough away, in my
picture: at the far end of the vertical through the observer.
The discussions serve to improve the knowledge of the interlocutors and
this discussion is very useful to me.

What you wrote seems correct to me: a spherical body in motion
maintains its sphericity visually (and on the monitor) only in one
particular case and appears crushed in the other cases.

So, my two animations
https://www.geogebra.org/m/axxtdurx (The contraction is there but you
can't see it on the monitor)
https://www.geogebra.org/m/grq2shgx (The contraction is there and
appears on the monitor)
are both correct, one in one case and the other in another.

Is that it?
wugi
2023-06-16 19:36:33 UTC
Permalink
[[Mod. note -- I apologise for the delay in processing this article,
which arrived in the s.p.r moderation system on 2023-06-12. -- jt]]
Post by wugi
FWIW, Luigi, your animation is about Lorentz contraction, not about what
cameras will record.
If you want a related example (I'm not going to redo your simulation),
look again at my picture of watching the approach, passing by, and
https://wugi.be/paratwin.htm =>
https://wugi.be/MySRT/Squad.gif
The squares are Lorentz contracted (see "actual position" dots at the
right).
They are *seen* as quadrangles, ie distorted rectangles.
At approach there is blueshift, at regression redshift (my colors are
inverted, for a white background;).
At approach the speed seen is greater than the motion velocity v (it
becomes infinite for v=c), at regression it is less than v (it becomes
c/2 for v=c).
At approach there is a seen length expansion(! it becomes infinite for
v=c), at regression an extra length contraction(! it becomes L/2gamma
for v=c IIRC).
Now if you want to visualise spheres, or circles, fill in any of the
quadrangles with a corresponding ellipse-like figure, that's how the
distorted circles are going to be seen. If you want a symmetrical
circle, take 2*2 adjoining squares, 2 along either side of the axis of
symmetry through the observer (the small black circle).
FWIW, apart from the other visualisations I proposed, there is a nice
visualisation at the tachyon page
https://en.wikipedia.org/wiki/Tachyon
of how a *tachyon sphere* would be seen, that is, *if it existed*:
Loading Image...

In our subluminal (v < c) case, you can get a qualitative idea of the
equivalent visualisation,
- by applying length contraction for v to the grey ("actual") sphere,
- by noticing that the approaching ellipsoid (blue shifted) will be
moving in the same direction as the actual (grey), reaching the observer
together (the blue at a larger speed than v), and
- will proceed further as the red shifted ellipsoid, at a lower speed
than v, similar to this picture.
--
guido wugi
wugi
2023-06-18 23:53:01 UTC
Permalink
Post by wugi
...
As for the Terell rotation,
https://en.wikipedia.org/wiki/Terrell_rotation
as I've said before,
that's just a special case of the distortions seen, valid only
perpendicular to the direction of motion, and far enough away, in my
picture: at the far end of the vertical through the observer.
The discussions serve to improve the knowledge of the interlocutors an=
d
this discussion is very useful to me.
What you wrote seems correct to me: a spherical body in motion
maintains its sphericity visually (and on the monitor) only in one
particular case and appears crushed in the other cases.
So, my two animations
https://www.geogebra.org/m/axxtdurx (The contraction is there but you
can't see it on the monitor)
This is the *seeing* process.
So yes, you don't see the contraction (except perpendicular to the=20
motion, and far away, Terell-wise).
But no, you don't see the spheres "as is", but really with different=20
distortions at different positions.
https://www.geogebra.org/m/grq2shgx (The contraction is there and
appears on the monitor)
This is the "measuring" process.
So no, you won't see it "appear on the monitor". It will result from=20
measuring and calculating.
are both correct, one in one case and the other in another.
Is that it?
A last try, hoping to be clear:
I've adapted a bit my aforementioned picture to the case of passing=20
circles (spheres):
https://pin.it/3SpivNV

The "true" actual positions with length contraction are in grey, at the=20
right. See contracted circles.

The "seen" positions are in red=C2=B0 (approach) and bluegreen=C2=B0 (reg=
ression),=20
with the distorted circles as (approximately) seen. No "perfect" circles=20
there!
=C2=B0 (negative Doppler colors. I've used "correct" blue and red instead=
for=20
the circles)

I've added the Terell rotation case, "to north and south of observer,=20
far away", compare with contracted grey circles in actual positions at=20
the right.

Hope you'll understand at last that there can be no question of a=20
*constant shape*, circle or not, to be *seen* passing by.

--=20
guido wugi
Luigi Fortunati
2023-06-21 09:08:17 UTC
Permalink
Post by wugi
....
Hope you'll understand at last that there can be no question of
*constant shape*, circle or not, to be *seen* passing by.
Yes, I understood that you can't see a body of constant shape passing
by throughout the movement.

And I agree with you.

But the photos don't show any movement, they are instantaneous and are
the ones you see in my 2 animations when we press the "Position:C=D"
button.

We can say that (based on the position of the camera) in one case the
photo will look like in the animation
https://www.geogebra.org/m/grq2shgx
in another as that of animation
https://www.geogebra.org/m/axxtdurx
and in another will it be even different?
wugi
2023-06-23 16:20:10 UTC
Permalink
Post by Luigi Fortunati
Post by wugi
....
Hope you'll understand at last that there can be no question of
*constant shape*, circle or not, to be *seen* passing by.
Yes, I understood that you can't see a body of constant shape passing
by throughout the movement.
And I agree with you.
But the photos don't show any movement, they are instantaneous and are
the ones you see in my 2 animations when we press the "Position:C=D"
button.
So the animation should be disposed of?
Post by Luigi Fortunati
We can say that (based on the position of the camera) in one case the
photo will look like in the animation
https://www.geogebra.org/m/grq2shgx
If you agree with me, then why do you keep insisting on the assumption that length contraction could be "photographed" instantly?
Post by Luigi Fortunati
in another as that of animation
https://www.geogebra.org/m/axxtdurx
and in another will it be even different?
If you agree with me, then why do you keep insisting on the assumption that a relativistic body could be "photographed" unaltered?

But you inspired me to update my "relativistic squadron watching", so you can try it out here:
https://www.desmos.com/calculator/yey8cgrgat?lang=nl

Moreover you inspired me to modify it into "relativistic circle watching", precisely your thema here, with choices of radius and position, so you can try here, and find out that "perfect circles" are nowhere to be "seen":
https://www.desmos.com/calculator/yxmju4xjrd?lang=nl
--
guido wugi
wugi
2023-06-24 06:44:04 UTC
Permalink
Post by wugi
https://www.desmos.com/calculator/yey8cgrgat?lang=nl
https://www.desmos.com/calculator/yxmju4xjrd?lang=nl
After necessary corrections and some additional features:
Squad
https://www.desmos.com/calculator/kefqjx5yul?lang=nl
Circle
https://www.desmos.com/calculator/eyxedvdu6c?lang=nl

I thought I had saved the same file (same name), but Desmos manages to make it different files with same name, which I don't understand, sorry.
--
guido wugi
Luigi Fortunati
2023-06-27 19:20:24 UTC
Permalink
Post by wugi
So the animation should be disposed of?
No, my animation is certainly fine at the top showing the actual
contraction.

The lower part (the monitor, the visual part) must be corrected only in
the form of the deformation which is not symmetrical as I have proposed
but is more ramshackle, as you correctly propose it with your
animations.

Loading...